Introduction
The first step in any quantitative analysis or algorithmic trading journey is getting historical data that you can test algorithms and models against for backtesting.
In this article, I’ll demonstrate how to get cryptocurrency data for every minute of data available from 2017 for multiple currencies and exchanges in a few hours.
More specifically, I’ll show you:
- How to connect to Polygon’s REST API.
- Retrieve data for every minute of historical data for a cryptocurrency.
- Store that data into a local database.
- Retrieve that data from your local database so you can test algorithms against it (or, whatever you want to do with the data).
That’s millions of points of data that can be collected while you drink your coffee.
Not only that, but you’ll have the data accessible to be used very quickly for backtesting algorithms and quantitative analysis.
There are some prerequisites to getting this up and running.
You should probably be somewhat familiar with coding in JavaScript (though I’ll try my hardest to make it easy enough for anyone to do it).
You’ll need a polygon.io account, with a “Currencies Starter” subscription.
Where to get data
There are a lot of places to get historical aggregate ticker data for cryptocurrencies. There’s free data sources and paid data sources.
Like my dad used to say when I was growing up, “you get what you pay for.”
This article focuses on getting data from polygon.io. Polygon is a developer first data source for both US market trade data and cryptocurrency data from multiple exchanges.
I’ll be doing all of the code in Node.js, which is a JavaScript server engine. It makes it easy to connect to APIs and fetch data, as well as send data where you want it to go.
Setting up an account with Polygon.io
Polygon’s Currencies Starter unlimited access plan is $50/month.
You’ll definitely be able to get the data you need within the month, so this process would cost you $50 total to get millions of historical data points across multiple cryptocurrencies.
First, create an account.
Once you create an account, you’ll want to make sure you subscribe to the Currencies Starter plan.
Then, once you’re billed $50, you’ll have unlimited API calls to obtain the data.
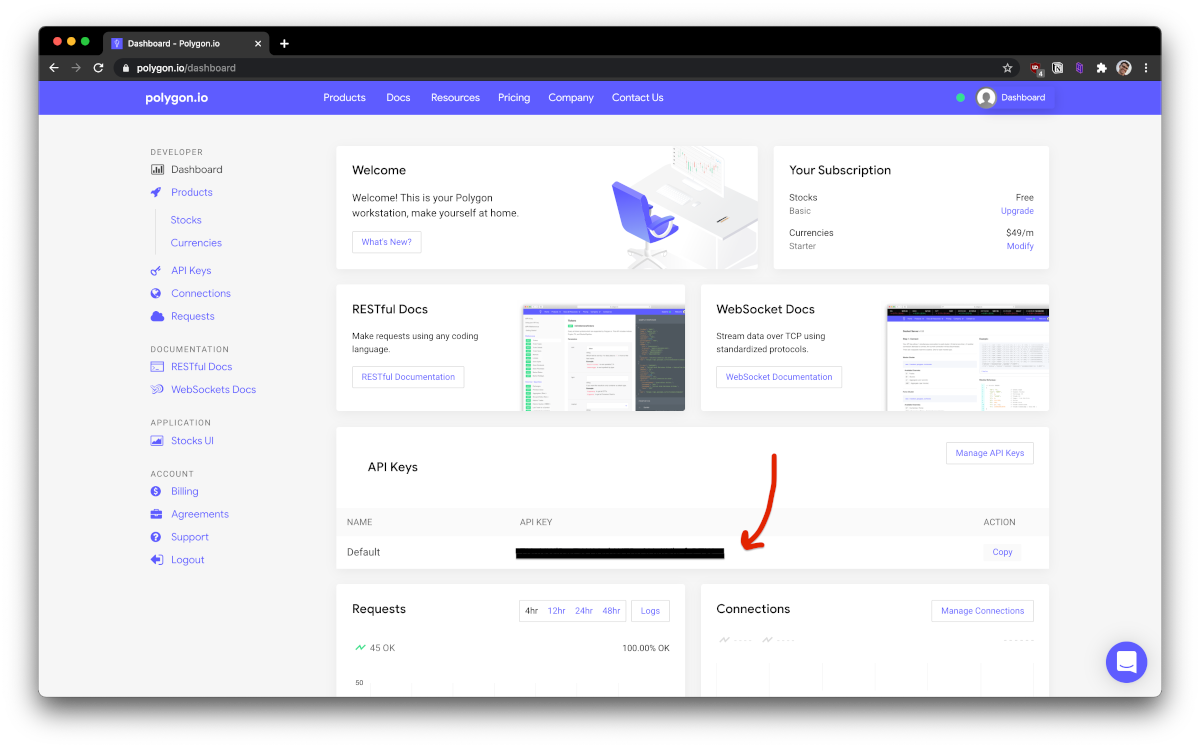
On your dashboard you’ll see the API Keys section. That’s important for what we’re doing.
Getting your development environment set up
Before we actually interface with the Polygon API to get data, we have to get our coding environment set up.
Installation
Things you’ll need to install:
- Visual Studio Code – for editing your code.
- Node.js – a JavaScript runtime engine for interfacing with the API. Get the LTS version. Not the latest version.
I don’t plan on including how to get those things set up and working, there should be enough documentation within the individual projects to make sure you have it all installed correctly.
(Hint: if you get stuck, just Google stuff).
Create a Node project
First, create a new directory (folder) on your computer for your project. It could be in your desktop, documents, wherever you’d like.
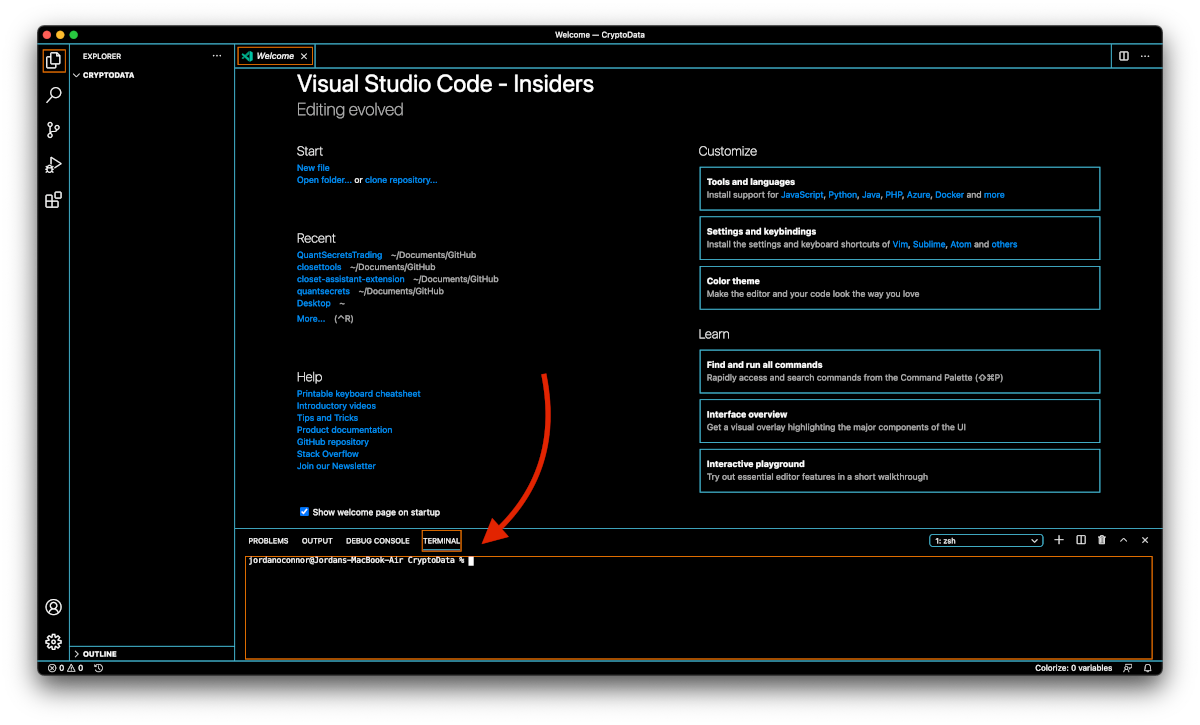
Next, open Visual Studio Code, and on the start page, click the “Open Folder…” option. Open the folder you created.
If you’re on a Mac, type ⌃+` (that’s control + back-tick) on your keyboard to open the terminal in Visual Studio Code.
If you’re on Windows, type Ctrl+` (that’s control + back-tick) on your keyboard to open the command line in Visual Studio Code.
Add dependencies
In the terminal, run npm install dotenv node-fetch sqlite3 --save to install the necessary libraries.
Once that’s done running (it can take a minute to finish), you should see a folder in your directory called node_modules. There’s nothing you need to do in there, but it needs to be there.
Alright, now it’s time to write some code.
Create an environment file
We’re going to add a secret file that contains the API key of your Polygon account. This isn’t critical, but if you’re going to be publishing anything online you’ll want to make sure your keys are kept private.
Create a file called .env in the root of your directory.
One easy way to do that, is to hover over the explorer section on the left side of Visual Studio Code, and at the top you’ll see a “New File” button. The other way is to right-click the explorer section and click “New File.
Once you create the file, it should open. Now, you’ll want to paste in the following:
POLYGON_API_KEY=REPLACE_THIS_WITH_YOUR_API_KEYIf the hint in the code above wasn’t enough, you’ll want to replace the part after the equals sign with your API key which is found in the dashboard of your Polygon account.
Once that’s all set up, you’ll be able to access your API key in your code in a way that won’t expose it to the public.
Include modules
Now, create a new file called data.js. You can make it in the root of the directory you’re in.
Once you’ve created your file, it should open in Visual Studio Code. If not, then you’ll want to open it.
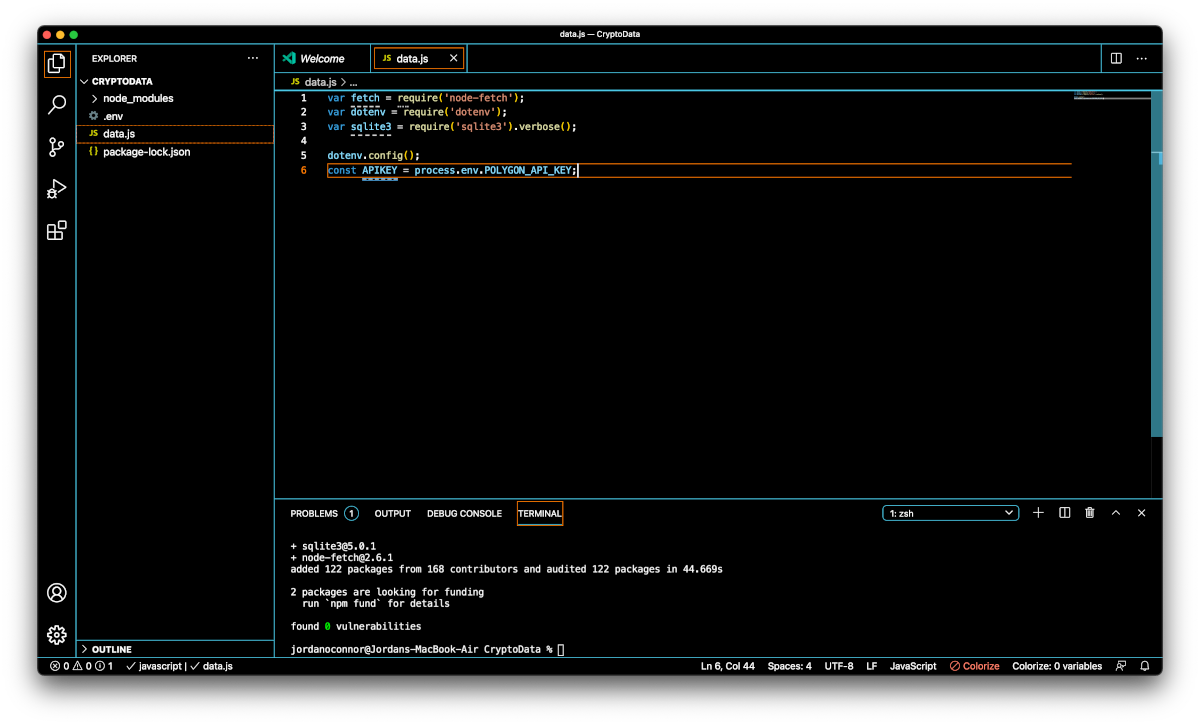
At the top of your file, you’ll want to copy and paste the following:
var fetch = require('node-fetch');
var dotenv = require('dotenv');
var sqlite3 = require('sqlite3').verbose();

dotenv.config();
const APIKEY = process.env.POLYGON_API_KEY;
This includes the libraries we installed earlier, and it sets up your API key as a global variable called APIKEY.
If you didn’t create the .env file in the step above, you’ll just want to replace process.env.POLYGON_API_KEY with your actual API key (as a string, with quotes around it).
Using Polygon’s REST API to get historical crypto data
Before we start working with the API directly, there’s a few sections of structural code I’ll give you.
These will all be pasted into your data.js file. I’ll briefly explain what they do and how they work.
Date string manipulation
Part of working with the Polygon API is getting the dates for the data we want to access.
Not only do we need the dates, but they have to be in the right format.
Simply copy and paste the code below into your data.js file.
function dateString(d) {

    // If the day is less than 10, add a 0
    let dString = null;
    if (d.getDate() < 10) {
        dString = '0' + d.getDate();
    } else {
        dString = d.getDate();
    }

    // If the month is less than 10, add a 0
    let mString = null;
    if ((d.getMonth() + 1) < 10) {
        mString = '0' + (d.getMonth() + 1);
    } else {
        mString = (d.getMonth() + 1);
    }

    // Get the year string
    let yString = d.getFullYear();

    //Put it all together in an object
    rd = {
        month: mString,
        day: dString,
        year: yString
    }

    //Return the formatted date string
    return rd;
}
Getting one day of data, in one minute increments
Alright, this function is the bread and butter. This code directly talks to the Polygon API, and asks it for a day of data in minutes starting with the day that you pass into the function.
Simply copy and paste the code below into your data.js file.
// Pass a date and a valid currency symbol into this function
async function getData(start, symbol) {
// If no currency is passed in, default to Bitcoin
if (!symbol) {
symbol = "BTCUSD";
}
// Convert the start date to the proper format
let startDay = dateString(start);
// Create the new end date
const end = new Date(start);
end.setDate(start.getDate() + 1);
// Convert the end date to the proper format
let endDay = dateString(end);
// Combine the dates into the right string format
let startString = startDay.year + "-" + startDay.month + "-" + startDay.day;
let endString = endDay.year + "-" + endDay.month + "-" + endDay.day;
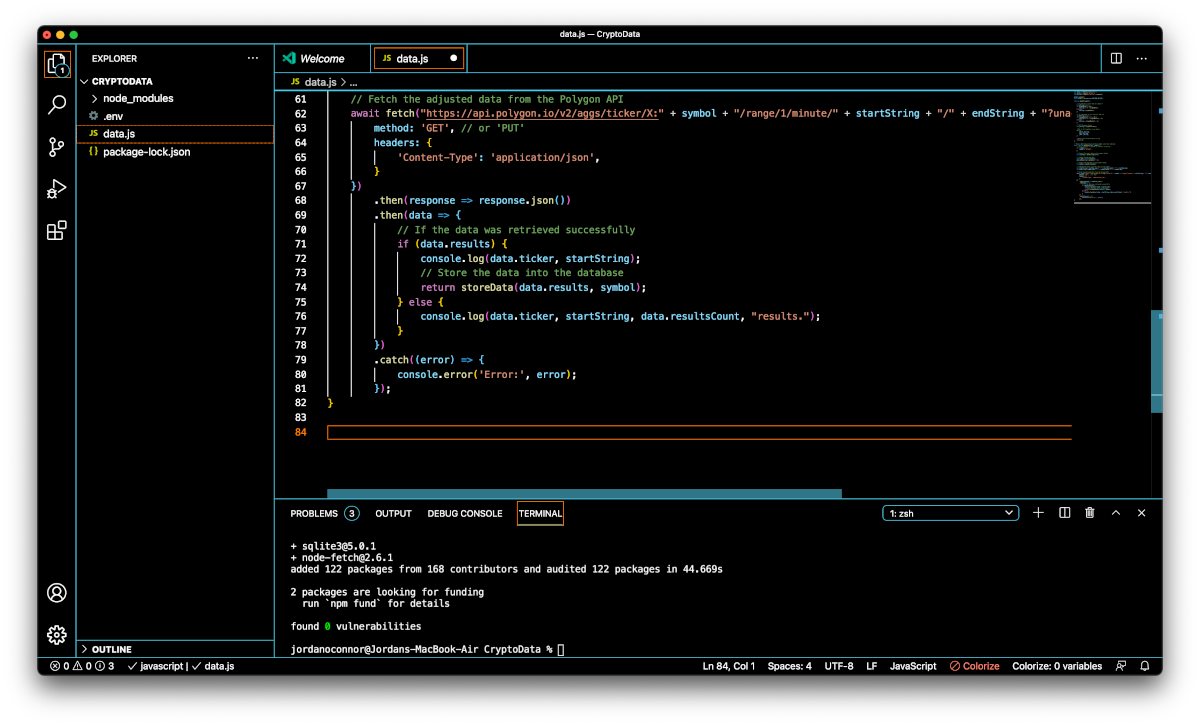
// Fetch the adjusted data from the Polygon API
await fetch("https://api.polygon.io/v2/aggs/ticker/X:" + symbol + "/range/1/minute/" + startString + "/" + endString + "?unadjusted=false&sort=asc&limit=10000&apiKey=" + APIKEY, {
method: 'GET',
headers: {
'Content-Type': 'application/json',
}
})
.then(response => response.json())
.then(data => {
// If the data was retrieved successfully
if (data.results) {
console.log(data.ticker, startString);
// Store the data into the database
return storeData(data.results, symbol);
} else {
console.log(data.ticker, startString, data.resultsCount, "results.");
}
})
.catch((error) => {
console.error('Error:', error);
});
}
Cool. You can see some of the comments in the code that explains a little bit about what’s going on.
Storing the data into a local database
Now we’ll get into the local database stuff. This is where you’re going to store the data that you retrieve from Polygon so you can do your backtesting.
Creating a database
First, we’ll need a function to create the database. This code will create a database in your root directory with the name of the currency you’re retrieving.
Simply copy and paste the function below into your data.js file.
// Pass in the symbol of the currency wanted
function createNewDb(symbol) {
    // Allocate a new database.
    let db = new sqlite3.Database(symbol + '.sqlite3');
    // Create the database.
    db.run('create table if not exists tickers(date NUMERIC, open NUMERIC, close NUMERIC, high NUMERIC, low NUMERIC, volume NUMERIC, average NUMERIC, UNIQUE(date))');
    // Close the database.
    db.close();
}
The above code is a bit complex, but you’re creating a database with the columns:
- Date
- Open price
- Close price
- High price
- Low price
- Volume (for the day)
- Average (for the day)
The ‘UNIQUE(date)’ lets the database know that there should only be one entry for each date that’s entered (just in case there’s any confusion).
Basically, each data point is a row in your table. It’s like a giant excel spreadsheet.
Storing the data
Now, let’s add the function for storing the data into the database.
// Pass in the data, and the symbol of the currency
async function storeData(results, symbol) {
    // Get the database that was created before
    let db = new sqlite3.Database(symbol + '.sqlite3');
    // These are the commands to insert the data into the database
    let sql = `INSERT OR IGNORE INTO tickers(date, open, close, high, low, volume, average) VALUES(?, ?, ?, ?, ?, ?, ?)`;
    // This actually puts the data into the database
    db.serialize(async function () {
        var stmt = db.prepare(sql);
        for await (const result of results) {
            let params = [result.t, result.o, result.c, result.h, result.l, result.v, result.vw];
            stmt.run(params);
        }
        stmt.finalize();
    });
    // Close the database connection
    console.log(symbol, "store done.");
    db.close();
}
Sweet. Now we’re getting somewhere. We can now get data and we can send it somewhere.
Getting years of data for multiple cryptocurrencies
Here’s where the rubber meets the road. We have to tell the code that we copied in above to get data for multiple days and for multiple different currencies.
Specify the start date and end date
In the code above we made a function that gets the data for every minute of a day. Now, we’ll call that function every day from a start date to an end date.
Here’s the code for that:
// Pass in a start date, end date, and the currency symbol
async function getDataFromTo(startDate, endDate, symbol) {
    setTimeout(async function () {
        // This 'incdate' will increment to the end date
        let incDate = new Date(startDate.getTime());

        // If there's no end date, make the end date last week
        let currentDate = new Date();
        if (!endDate) {
            currentDate.setDate(currentDate.getDate() - 7);
        } else {
            // Otherwise, use the end date specified
            currentDate.setDate(endDate.getTime());
        }

        // Get the data for a day
        await getData(incDate, symbol);

        // Go to the next day, and start it all over again until the end date
        incDate.setDate(incDate.getDate() + 1);
        if (incDate < currentDate) {
            await getDataFromTo(incDate, endDate, symbol);
        }
    // Asks for new data every 2000 milliseconds (2 seconds)
    }, 2000)
}
Hopefully that makes sense. Basically, it walks it’s way from the start date to the end date and collects data along the way.
Specifying the currencies you want to get
Now, this code you might want to edit depending on what data you want. I grabbed the top 20 cryptocurrencies listed on Bitfiniex.
This code takes your array of currency symbols, and walks through to obtain all of the data for each of them.
// Pass in the start date, and the currency symbols [array]
async function getMultipleCurrencies(startDate, symbols) {
for await (const symbol of symbols) {
// If the database doesn't exist
createNewDb(symbol + "USD");
// Get the data from the start date until last week
await getDataFromTo(startDate, null, symbol + "USD");
}
}
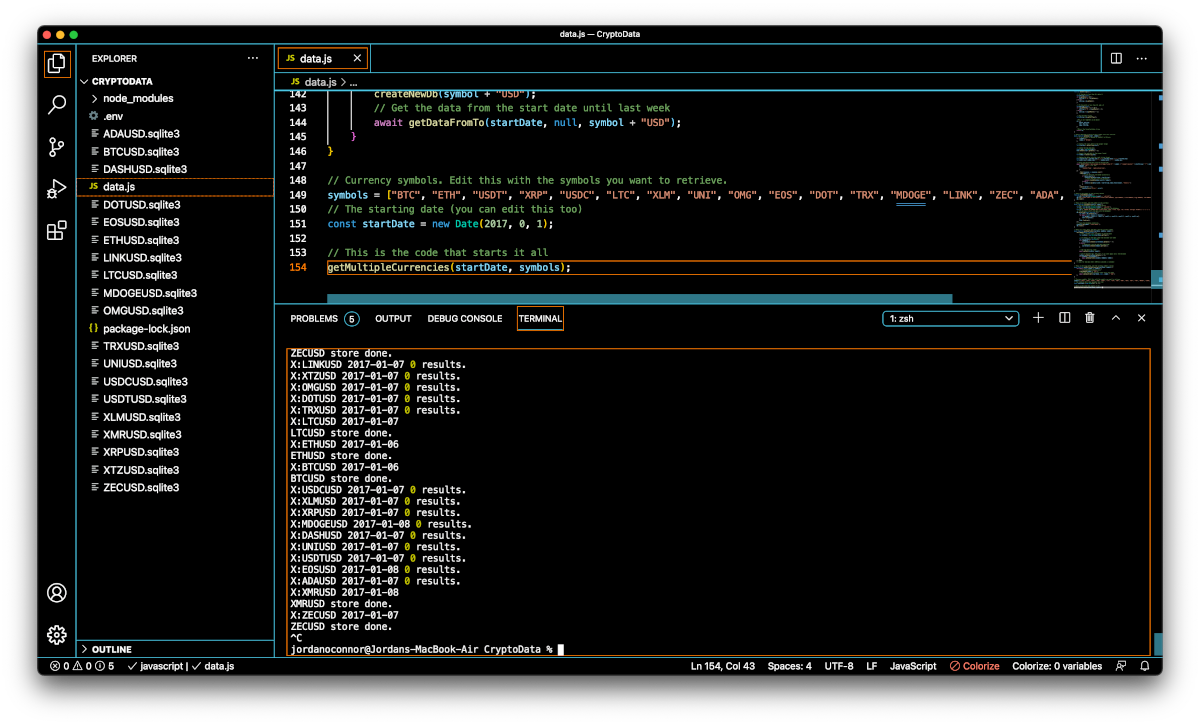
// Currency symbols. Edit this with the symbols you want to retrieve.
symbols = ["BTC", "ETH", "USDT", "XRP", "USDC", "LTC", "XLM", "UNI", "OMG", "EOS", "DOT", "TRX", "MDOGE", "LINK", "ZEC", "ADA", "XTZ", "DASH", "XMR"];
// The starting date (you can edit this too)
const startDate = new Date(2017, 0, 1);
// This is the code that starts it all
getMultipleCurrencies(startDate, symbols);
Awesome. Now you have all the code you need retrieve and store historical cryptocurrency ticker data.
There’s a couple of things you can edit based on your preferences. First, is the symbols. You’ll want to put in the symbols as you see them (for example, on Bitfinex), and in all-caps.
For the startDate, it’s formatted as new Date(year, month, day). The month is slightly different than the year and the day because it is zero based (January is 0). You can put whatever starting date you want in there.
One thing you’ll find with some of the more obscure cryptocurrencies is that there is no long-term data. There might not be data in 2017 for some of them. That’s okay, the code will just skip by days with no results.
Running your code
If you followed the instructions (copied and pasted all of the code), then you should be all set to start retrieving data from Polygon.
Starting the code is pretty easy. All you need to do is run node data.js in your terminal (the one we used to install the npm packages earlier).
Once you do that, you should see the code create a bunch of databases in the explorer window, and it will also start telling you what’s happening in the terminal.
This code can take a while. It grabs data every 2 seconds for each of the days. For my 20 currencies, it took roughly an hour and a half to get all of the data.
Retrieving data from your database
This is a little further down the line, but if you want a way to get the data out of your table, you can do so with this function:
function getTable(symbol) {
    // Connect to the database
    let db = new sqlite3.Database(symbol + '.sqlite3');
    console.log(symbol + '.sqlite3')

    // Retrieve the data, in order by date
    let sql = `SELECT DISTINCT Date date, Close close FROM tickers ORDER BY date`;
    let data = null;

    // Actually retrieve the data
    db.all(sql, [], (err, rows) => {
        if (err) {
            console.log(err)
            throw err;
        } else {
            console.log("Got the data.")
            data = rows;
            // close the database connection
            db.close();
        }
    });
    return data;
}
And then to execute the function, you can do something like this:
// Get data from your BTCUSD table (if you have one)
let tickerData = getTable("BTCUSD");
Then, later on, you can access all of the table’s data from the tickerData object.
That’s assuming you know how to code. And if you don’t, I think you should learn. Free code camp is the best place to do that.
Wrapping up
That ends this tutorial. I hope it was helpful for you.
If you get stuck, Google stuff. If Google doesn’t help, you can reach out to me on Twitter.
Jordan ✌️